Monday, June 20, 2016

Static Analysis Testing with NDepend

Introduction


In this article we will talk about a static analysis tool, called NDepend, that offers a wide range of features to let the user analyze a code base, that is often described as a Swiss Army Knife for .NET developers :).
For those that don't know, the definition for Static program analysis from wikipedia is "the analysis of computer software that is performed without actually executing programs (analysis performed on executing programs is known as dynamic analysis). In most cases the analysis is performed on some version of the source code, and in the other cases, some form of the object code".

Installation


In order to use NDepend in Visual Studio, you need to download NDepend installtion zip file, from here http://www.ndepend.com/download. You can use the product, with all functionalities included, free, for 14 days. After downloading the zip file, you need to start NDepend.VisualStudioExtension.Installer.exe and choose Visual Studio versions for which you want to have NDepend.
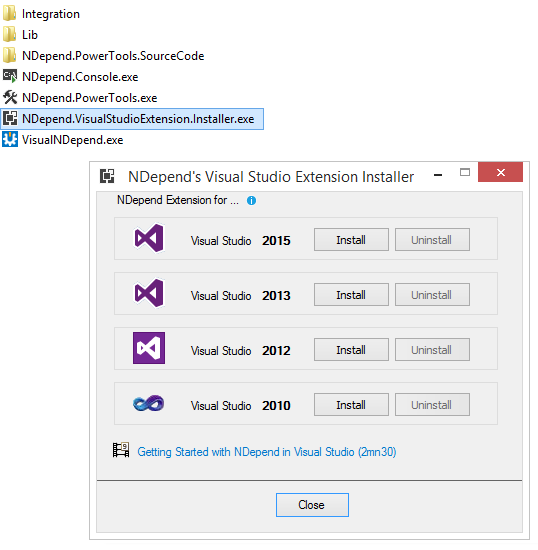
Open Visual Studio. You will notice a new menu: NDepend.


Analyze a Visual Studio Solution


After the add-in is installed, you have to open the Visual Studio solution that contains the code that you want to analyze. You can start analyzing the code either from menu  NDepend > Attach new NDepend project to current Visual Studio solution or from the circle status icon that can be found on the bottom right of the Visual Studio window.


The dialog that will be opened will be include all .NET assemblies of the Visual Studio solution. In this dialog you have the possibility to add more .NET assemblies compiled from another solutions. 


Clicking on Analyze .NET Assemblies, will generate very fast, in a few seconds, a report with the analysis of the code source. 

Analyze .NET Applications


Besides NDepend.VisualStudioExtension.Installer.exe add-in, we can analyze .NET applications with VisualNDepend.exe that you'll find it in the downloaded zip file. With this you can analyze VS solutions and projects, analyze .NET assemblies or a set of .NET assemblies.


NDepend Report


After you start analyze the code, a report in format HTML will be generated. Also, in Visual Studio, you be asked to see the Dashboard, show graphs, browse code rules.


NDepend Dashboard looks like this:


NDepend Report looks like this:


What does NDepend report tells about the code? 
  • Application Metric: What is the topology of your application?
  • Assembly Metric: What is the size of each assembly within your application in terms of #IL instructions and others metrics?
  • VisualNDepend View: What are the sizes of your assemblies, namespaces, types and methods in terms of #IL instructions?
  • Assembly Abstracness vs. Instability: What is Abstracness/Instability principle explained in the assemblies metrics section?
  • Assembly Dependencies: What are the dependencies between assemblies in your application?
  • NDepend information and warnings: How should we organize your code:?
  • CQLinq Queries and Rules: What are the default CQLinq rules which have been violated?
Below, you can see some diagrams for a testing project that is using Page Object principles in order to perform GUI testing with selenium web driver and applitools.


NDepend Features - Rules


Go to http://www.ndepend.com/features/ in order to discover all NDepend features. Below we will talk only about code rule and code query over LINQ, which, thanks to CQLink allows us to query the code in order to identify potential problems.
There are around 200 default queries and rules that you can use to analyze the code, but you can define your own rules and queries. CQLinq editor is very easy to use and it supports code completion, includes documentation, compile error description.


After the query is compiled, it will automatically be executed and the results will be shown and will be browsable.


Below you can see some rules and queries examples, taken from NDepend site.


Conclusions


NDepend is a great static analysis tool, very well documented, easy to use, giving you insights into the health of your code.

Happy testing and... make it green, becomes a dream :).

Friday, June 17, 2016

The Agile Testing Quadrants

When we think of software quality, we must take into account all its dimensions. For each dimension a different testing approach should be used. Do we know what type of testing we should perform, when to stop testing? To answer these questions, Agile Testing Quadrants will help us cover all categories of testing we need to do. The image below shows how each of the four quadrants reflects the testing we perform.


On Y axis, tests are divided into tests that support the team or critique the product. On the X axis, tests, they are divided into business-facing and technology-facing tests.

The tests that are supporting the product, from Quadrants 1 and 2, are those that support the team while the product is developed. Quadrant 1 should include test-driven development, which is the core of agile approach. Quadrant 2 also supports the development's work, but at a higher level. The tests defined here are the result of customer's examples,  that are describing details of each story. It is possible that some tests are duplicating others from the first quadrant, but these are more system behavior oriented.

The tests that are critiquing the product should not be interpreted in a negative way. As a customer, I may think differently of a programmer, I may have different expectations related to the product behavior. Business-facing examples from Quadrant 3, help the team to design the desired product. Also, it will try to emulate the way the real user will use the application. the testing is usually performed by customers. The tests from Quadrant 4 are just as critical to agile development as to any type of software testing. They are criticizing product characteristics like performance and security.

Read more about agile testing in this book: Agile Testing: A Practical Guide for Testers and Agile Teams.

Happy testing and... make it green, becomes a dream :).

Monday, June 6, 2016

Selecting your Elements with XPath and CSSSelector

How my Desktop looks like :)?


This is an useful wall-chart from Rosetta Stone and Cookbook that covers popular technologies as XPath, CSS.

Some examples of how to use this wall-chart:

1. Use this By.CssSelector("g[id^='milestone']") to identify element below:


2. Use Instance.FindElements(By.CssSelector(".cellContent > a > div"), Ex)[i] to find all elements below: 


3. Use By.CssSelector(".ember-view.timeband-scale-format>div:first-of-type>div>ul>li>a")


Happy testing and... make it green, becomes a dream :).

Friday, May 27, 2016

Selenium Roadmap

We know that Selenium is an open source tool used to perform UI testing. Since July 2011, we started to use Selenium 2.
But we wonder what is the future of Selenium? The community developers are working to release Selenium 3.


The aim for Selenium 3 is to be "a tool user-focused automation of mobile and web apps". What does it mean? See this link to found out: https://seleniumhq.wordpress.com/2013/08/28/the-road-to-selenium-3/.

Also, there is a new webinar recording about the future of Selenium here: http://testautomation.applitools.com/post/144952401467/webinar-recording-selenium-30-the-spec-and.

Happy testing and... make it green, becomes a dream :).

Monday, May 9, 2016

HTTP Fox - A Firefox add-on for monitoring traffic

Introduction


Http Fox is a firefox add-on that can be installed from here: https://addons.mozilla.org/en-US/firefox/addon/httpfox/ and it monitors and analyzes all incoming and outgoing HTTP traffic between the browser and the web servers and which can be used as an alternative to Firebug’s NET Panel.

Information available per request includes:
- Request and response headers
- Sent and received cookies
- Querystring parameters
- POST parameters
- Response body

Why to use it?


Can be detached from Firefox.
Search filter on live results as they come in


How to use it?


After you installed it, open Firefox and press CTRL + SHIFT + F2.
Press in Start button. While the page is loading the files are listed. 


We can filter files by entering a value in the filter field.


You can also see information about Request Cookies, Request Post Data, Content


More about performance testing: The Art of Application Performance Testing: Help for Programmers and Quality Assurance

Happy testing and... make it green, becomes a dream :).

Friday, April 15, 2016

Your First Protractor Test in Visual Studio 2015

Introduction


In this article we'll see how we can create our first project in Visual Studio 2015 that uses Protractor to test an angularJS application.
What is Protractor: "... is an end-to-end test framework for AngularJS applications. Protractor runs tests against your application running in a real browser, interacting with it as a user would."
The official site is this: http://angular.github.io/protractor/#/. 


Why to use Protractor


The main reason for using Protractor is that will recognize specific AngularJS identifiers, like model, repeater, etc.


Another important reason for using it is that when running tests you don't need to wait until the response will return.


Requirements


In order to be able to run Protractor tests we need first to have
- java sdk installed: http://www.oracle.com/technetwork/java/javase/downloads/index.html
- node.js installed: https://nodejs.org/en/download/
- NodeJS Tools for Visual Studio 2015: https://www.visualstudio.com/en-us/features/node-js-vs.aspx


Installation


After node.js was installed on your computer you can use npm to install Protractor globally with:


This will install 2 commands, protractor and webdriver-manager. To verify if protractor was installed run this command in your cmd: protractor --version. Protractor is installed globally under: c:\Users\yourUser\AppData\Roaming\npm\. Webdriver-manager is the tool that will instanciate a Selenium Server. In order ro use it and to start it we need to:


This needs to remain opened while you are running your tests. It will start up the Selenium Server and will output logs. Protractor tests will send requests to this server to control a local browser. 
Below you can see in mode details what Protractor's doing:


Writing your first test


Open Visual Studio 2015 and create a new project of type Blank Node.js Console Application. 


Delete app.js, because you'll don't need it. You'll notice that in your npm references, protractor will be available as a global one.


Protractor needs 2 files to run, a spec.js file that contains the tests and a conf.js file that will tell what specifications will be run and where to talk to Selenium Server (seleniumAddress).
Add the conf.js and spec.js files to your project.


Spec.js should have the structure below, where describe and it represents Jasmine framework syntax. Browser is used by Protractor to navigate in the browser.


If webdriver-manager is already started, now you can run your test in the command line where your conf.js file is by using this command:


A Chrome browser window will be opened. In your cmd you should see the test result.


Using IntelliSense


If you want your jasmine, protractor syntax to be recognized in Visual Studio you need to do additional steps:
- open a cmd and run these commands npm tsd -g 
- then go to the location of your project (in our case c:\temp\Protractor\MyFirstProtractorExample\MyFirstProtractorExample\) and run the following commands 
tds install jasmine
tsd install angular-protractor
tsd install selenium-webdriver
These commands will install the necessary typings for your project


- then you need to add the typing reference to your spec file


More about AngularJS Testing you can find in this book: AngularJS Test-driven Development

Happy testing and... make it green, becomes a dream :).

Monday, April 4, 2016

SpecFlow - Using Hooks in your Tests

Introduction


In a previous article we talked about how we can create tests with Selenium and SpecFlow.This article explains how we can use Hooks to run our tests.


What are Hooks


Hooks = event bindings and can be used to perform additional automation logic on specific events, like, for example, the execution of a scenario. To make an analogy, think about Setup and Teardown attributes from nunit framework.


Types of Hooks


The names are intuitive
- Beforetestrun and aftertestrun represents the code that will be executed before and after all tests
- Beforefeature and afterfeature represents the code that will be executed before and after every feature
- Beforescenario and afterscenarion represents the code that will be executed before and after every scenario inside a feature
- Beforescenarioblock and afterscnearioblock represents the code that will be executed before and after every scenario block
To be more precise, below you can see an example of a scenario with 3 blocks. The test will be executed before and after Given/When/Then blocks

- Beforescenariostep and afterscneariostep represents the code that will be executed before and after every scenario step

Creating Hooks File


After you added the Spec Flow extension to your visual studio project, you are able to create a new item of type Hooks.


A default class is created:


Modify this class and add all hooks you need.

Restrict Hook Execution with Tag Filtering


Another specflow feature is to restrict hook execution based on the tags you set to your scenarios. If you didn't know for a scenario you can add a tab. Based on this you group your tests when running them. In the image below, the scenario tags are @Login and @forgotPassword


The code below from you hook file will be executed for those scenarios tagged with @Login and @forgotPassword (when we are in if)


Want to lean more about BDD? Have a look on this book: BDD in Action: Behavior-driven development for the whole software lifecycle


Happy testing and... make it green, becomes a dream :).


Popular Posts